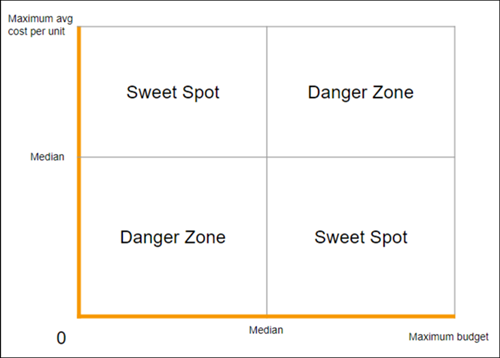
The Media Planning Center performs a calculation to determine the performance of a specific dimension in terms of past performance and planned budget. It uses a scatter plot quadrant display to perform this calculation.
At any particular point in time, the display shows a selected KPI against a certain dimension associated with the KPI in question and uses this logic.
- The average cost per unit (based on the previous year’s activity) is calculated. The
maximum result achieved for this calculation makes the extremity value on the Y-axis with 0
being the lowest value.
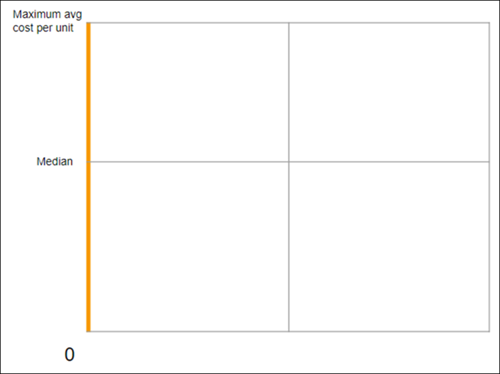
- At the same time, it also takes the highest budget value for the same entities and makes
that the extremity on the X-axis, with 0 being the minimum.
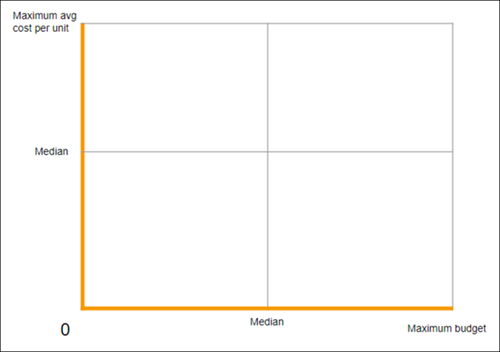
- Any average cost per unit that’s below the median is considered ‘cost-effective’, and any that’s above is considered too expensive. Likewise, any budget above the median is considered to be on the high side, and any that’s below is considered to be on the low side.
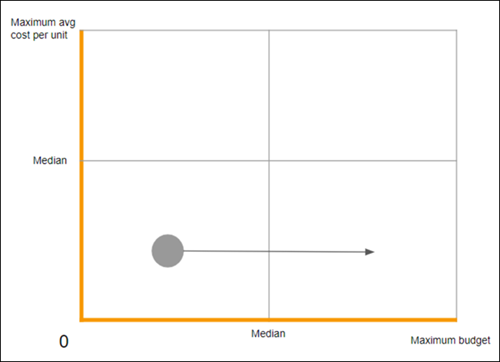
- Any entity that’s recognized as being cost-effective yet budgeted on the low side, is
considered to be badly budgeted. In this example, the entity has already proven itself to be
cost-effective so it makes sense to budget it relatively high. The Media Planning Center
recommends considering spending more on something that has a proven track record of being
cost-effective, therefore the entity is moved to the adjacent quadrant:
- Similarly, any entity that’s recognized as being expensive yet budgeted on the high side,
is also considered to be badly budgeted. This entity has already proven itself to not be
cost-effective, so it’s recommended to budget it relatively low.
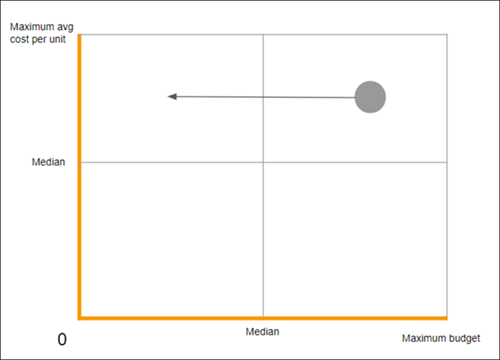
Here’s a summary of the sweet spots and danger zones: