
Business executives and line-of-business leaders use the CSI Overview tab to review the overall company health and performance. An AI-generated summary provides leaders insights about the top composite scores that are driving the all-up CSI score. Each of department's perception and the behavioral CSI score highlights the performance gaps and departmental risks. Leaders can also view a target list of accounts that require executive intervention to protect revenue or drive growth.
Required Editions
| View supported editions |
Global Filters
- Timeframe: Use this filter to focus the dashboard to a specific time period.
- Account: Use this filter to select a list of accounts for which you want to view the dashboard.
All-Up CSI Score and AI Summary
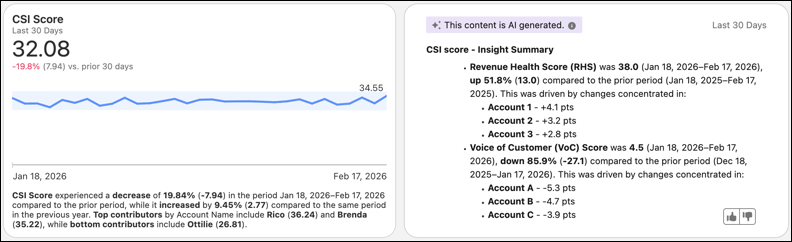
| Element | What It Does |
|---|---|
| CSI Score | The all-up CSI score integrates all composite scores into a single, trusted measure of overall customer and business performance. Rather than providing a static summary, it acts as an executive-level decision signal that reveals drivers, impact, and risk across the customer lifecycle. This comprehensive metric represents the holistic view of company health and serves as the definitive executive score. |
| Insight Summary | The AI-generated summary gives an immediate explanation of the top two composite scores that have impacted the all-up CSI score during the selected period. |
Perception and Behavioral CSI Score by Department
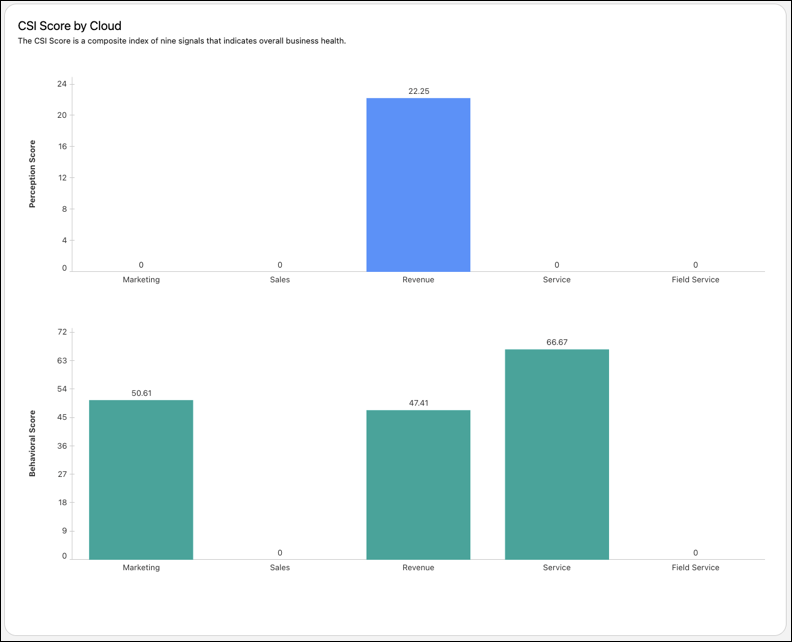
| Element | What It Does |
|---|---|
| Perception Score by Department |
These signals capture shifts in customer confidence, satisfaction, and brand perception. These scores are derived from customer feedback and sentiment signals, such as CSAT, survey responses, and sentiment extracted from conversations and emails. |
| Behavioral Scores by Department |
These signals indicate how customers are interacting with the business and often surface early operational or revenue-related risk. These scores are built from KPIs that reflect observable customer actions, such as renewals, opportunities won, usage patterns, and case resolution performance. |
Account Watchlist
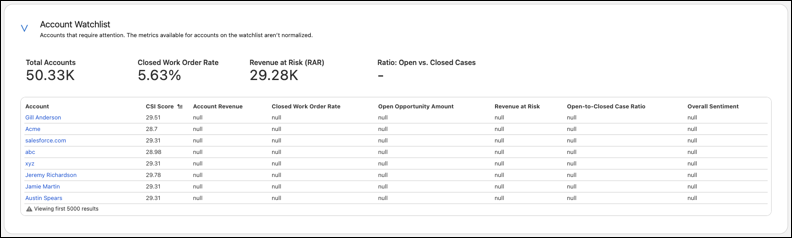
Review a curated watchlist of accounts requiring attention based on movement, risk, and impact. This list isolates the specific accounts driving the all-up CSI score. Leaders can focus on the customers that matter most and determine the most appropriate proactive response.
Composite Scores
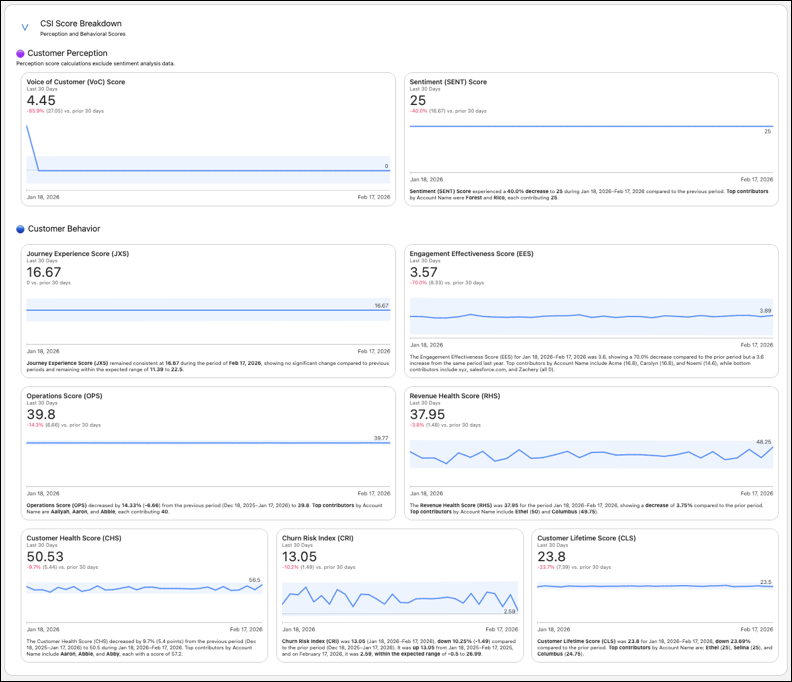
| Element | What It Does |
|---|---|
| Voice of Customer (VoC) |
Assesses how customers feel about their experiences. Serves as a key driver of brand reputation and customer advocacy. |
| Sentiment (SENT) |
Measures emotional tone across customer conversations, text, and feedback to reveal underlying attitudes and opinions. Drives proactive resolution and customer experience improvement by unifying textual and vocal sentiment across all interactions, including emails, calls, and tickets. |
| Journey Experience Score (JXS) |
Quantifies the quality of customer experience during journeys, such as brand introduction, quote-to-cash, service, and renewals. Drives funnel efficiency and conversion by highlighting where customers stall or succeed. |
| Engagement Effectiveness Score (EES) |
Quantifies the depth and frequency of customer interactions with products, services, and channels. Drives adoption, stickiness, and upsell opportunity by signaling the true level of customer commitment. |
| Revenue Health Score (RHS) |
Tracks contribution to top-line performance by combining revenue growth, lead-to-cash conversion, expansion, and retention outcomes. Serves as a key driver of top-line growth and pipeline health by quantifying the financial impact of accounts. |
| Operations Score (OPS) |
Evaluates the efficiency and effectiveness of internal processes that drive customer delivery. Drives cost optimization and service quality by measuring how well operations support the customer experience. |
| Customer Health Score (CHS) |
Integrates usage, adoption, and support signals to reflect the overall vitality of the customer relationship. Indicates account stability and renewal likelihood by quantifying how much customers depend on and value the company. |
| Churn Risk Index (CRI) |
Tracks behavioral and emotional warning signals from customers who are disengaging, downgrading, or expressing negativity. Highlights exactly when and where customers begin to withdraw, enabling proactive intervention to protect revenue before formal attrition occurs. |