
Evaluates the efficiency and effectiveness of internal processes that drive customer delivery. It evaluates process efficiency and quality of delivery across the value chain from marketing execution to quoting, servicing, and billing to drive cost optimization and service quality.
Required Editions
| View supported editions |
OPS Use Cases
- To assess the efficiency of support teams by monitoring case resolution speed and fix rates to lower cost-to-serve.
- To identify technical communication failures, such as high rates of SMS or email bounces, that disrupt scalable delivery.
- To benchmark the operational quality of field service teams regarding work order completion and consistency.
OPS KPIs
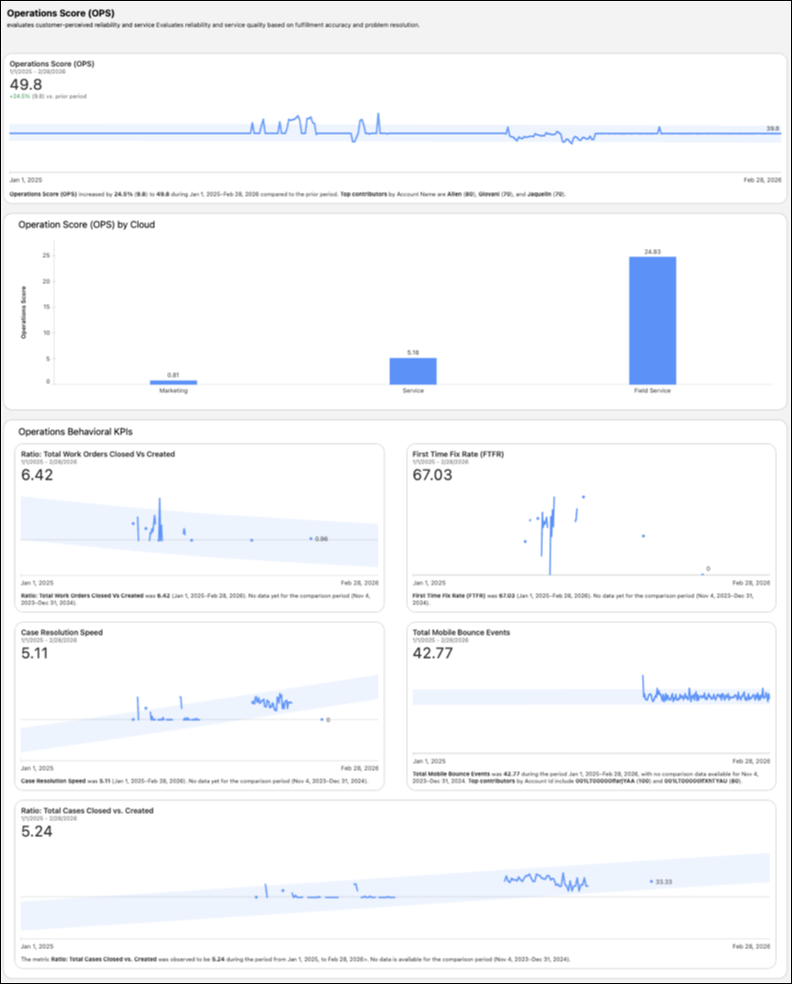
| KPIs | KPI Purpose |
|---|---|
| Operations Score (OPS) by Cloud |
Isolates operational efficiency by department to reveal exactly which part of the value chain is creating friction. It helps leaders pinpoint if delays are stemming from marketing delivery failures, slow quoting in sales, or service bottlenecks, enabling precise process tuning. |
| Closed Work Order Rate |
Measures the velocity of field operations by tracking the percentage of work orders that are successfully completed against those created. A high rate indicates an efficient dispatch and delivery system, while a low rate flags capacity issues or scheduling inefficiencies that need immediate attention. |
| First-Time Fix Rate (FTFR) |
Tracks the percentage of service issues resolved on the first attempt, serving as a primary indicator of technical competence and operational cost control. High FTFR directly reduces repeat calls, significantly lowering the cost-to-serve while boosting customer satisfaction. |
| Case Resolution Speed |
Tracks the average time that it takes to resolve customer issues from intake to closure. Optimizing this speed directly improves service margins by reducing the labor hours per case, while also preventing customer frustration caused by long wait times. |
| Total Mobile Bounced Event |
Measures the reliability of digital communication channels by tracking the volume of failed SMS or text message. High bounce rates signal data quality issues or technical failures in the last mile of customer communication, which can silently disrupt service delivery and engagement. |
| Account Watchlist |
Targets accounts disproportionately affected by process inefficiencies, such as high digital bounce rates, slow case resolution, or low FTFR. It identifies customers paying the price for operational bottlenecks, allowing teams to remediate specific service delivery failures. |