
Visualizes the correlation between the composite scores and their KPIs on a unified timeline. See the global top drivers for the composite scores that are derived from predictive models. Overlay KPI trends and use SHAP values to reveal cause-and-effect connections to validate hypotheses and pinpoint the exact levers driving overall business health.
Required Editions
| View supported editions |
KPI Relationship Use Cases
- To validate if specific operational improvements such as increasing first-time fix rate are directly impacting the overall Customer Health Score (CHS).
- To identify leading indicators by spotting where a dip in a granular KPI such as First-Time Fix Rate precedes a decline in the composite score.
- To isolate root causes, overlay potential drivers such as NPS and CSAT to see which trend line most closely tracks the composite score change.
- To prioritize the most impactful business levers by reviewing the top drivers to see exactly which KPIs are universally moving the needle across accounts.
KPI Relationship Trajectory
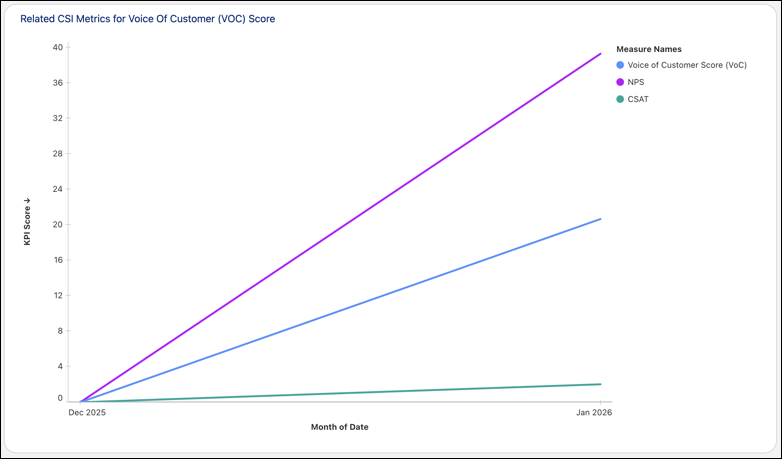
| Capability | Business Value |
|---|---|
| Timeline overlay visualization |
Plots the composite score and selected KPIs on a single chart to identify correlations. It provides immediate visual proof of how specific metrics influence the top-level score, distinguishing between coincidence and causation. |
| Multi-metric comparison |
Allows leaders to compare different combinations of KPIs against the main score. It enables rapid hypothesis testing, allowing users to rule out irrelevant data points and focus on the actual drivers of performance. |
| Historical trend analysis |
Shows performance shifts over customized time periods such as quarterly or monthly. It helps distinguish between temporary seasonal blips and long-term structural changes in business health. |
| Granular breakdown |
Links the high-level correlation view directly to the specific data points. It moves leaders from seeing the trend to understanding the data, helping bridge the gap between strategic observation and operational reality. |
Top Drivers
The visualization for the top drivers of each composite score uses SHAP values generated by the composite score-specific predictive models. Insights are calculated across all accounts to provide a holistic view of the factors driving scores up or down across the entire customer base.
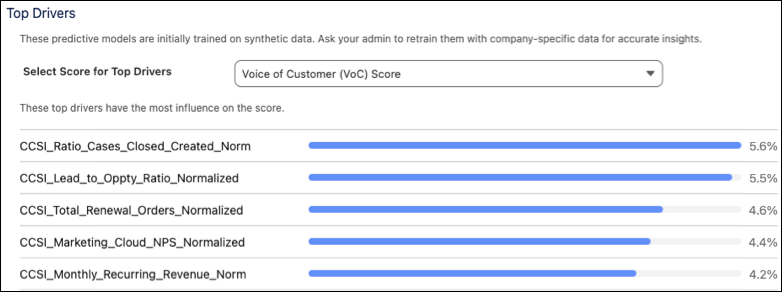
| Capability | Business Value |
|---|---|
| Visual priority ranking |
Shows a rank-ordered bar chart of the top KPIs influencing a specific composite score. It cuts through data noise and eliminates guesswork, focusing attention on the specific business levers that yield the highest return on investment. |
| Predictive impact quantification |
Uses global SHAP values on the x-axis to assign a concrete, comparative numerical weight to each driver. It translates complex predictive AI models to give data-backed justification needed for budget approval and resource reallocation. |
| Cross-organizational context |
Aggregates driver data across the entire customer base rather than isolating individual accounts. It makes sure that leadership is designing strategic initiatives to solve macro-level, systemic business challenges rather than over-indexing on one-off customer anomalies. |