
Explore the technical architecture and the tiered calculation logic of CSI Score. Discover how Data 360, semantic models, and Tableau Next turn raw signals into weighted composite scores and a definitive executive metric.
Required Editions
| View supported editions |
CSI Score Data Architecture
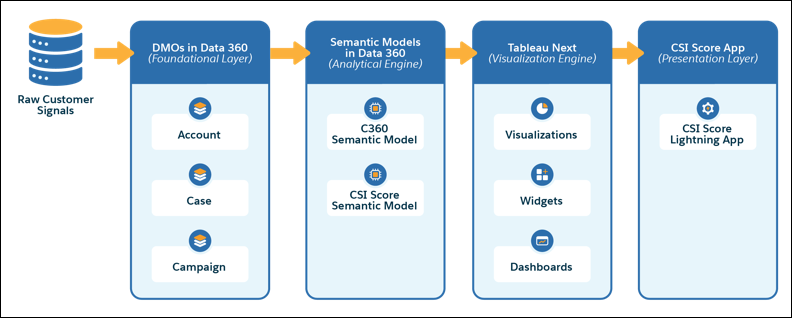
| Architecture Layer | What It Does |
|---|---|
| DMOs in Data 360 | Serves as the data foundation. It groups raw customer signals from across departments into data model objects (DMOs) to create a unified, query-ready dataset before any scoring logic is applied. |
| Semantic Models in Data 360 |
Functions as the analytical engine where signals and data are transformed into composite scores. The C360 semantic model first structures the data and then feeds it to the CSI Score semantic model. The CSI Score semantic model contains the business logic for the composite scores and the all-up CSI score. |
| Tableau Next | Acts as the visualization engine. It connects to the semantic models in Data 360 to consume the pre-calculated metrics, translating the complex scoring logic into interactive visualizations, widgets, and comprehensive dashboards. |
| CSI Score App | Acts as the presentation layer where the Tableau Next dashboards are embedded for business executives. It provides a unified, everyday workspace for decision-making, allowing leaders to monitor overall business health, score trends, and actionable watchlists. |
Score Calculation Logic
CSI Score translates complex customer signals from multiple sources into decision-ready intelligence that leaders can trust. Rather than simple averages, the framework standardizes KPIs and applies governed weighting to make sure that scores are statistically sound, strategically aligned, and business-relevant. The logic makes sure that every score clearly communicates what is changing, why it’s changing, and where risks or opportunities exist.
Understanding this logic is easier if you visualize it as a 5-tier pyramid. Data flows from the bottom up, getting refined mathematically at each step until it becomes a single, actionable score.
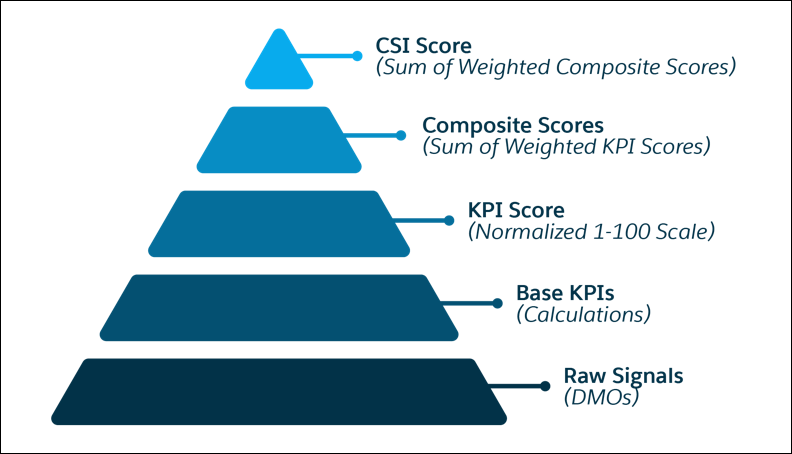
- (Tier 1) Raw Signals (Data Sources): Sources the raw data residing in data model objects (DMOs), such as a Case, an order amount, or a survey response.
- (Tier 2) Base KPIs (Calculations): Summarizes the raw data into fundamental KPIs, such as counting closed cases or summing total revenue.
- (Tier 3) KPI Scores (Normalized 0–100 Scale): Converts KPIs measured in different units
such as percentages, counts, ratios, and monetary values into a standardized 0–100
scale.
This normalization enables fair comparison across domains, meaning a high revenue amount (a $1 million deal) becomes mathematically comparable to a 5-star rating. It makes sure that leaders can evaluate a shift in CSAT seamlessly alongside a change in Revenue at Risk on a common scale.
- (Tier 4) Composite Scores (Sum of Weighted KPI Scores): Groups the normalized KPI scores
and applies governed weighting to calculate the composite scores.
Weighting is intentional and informed by statistical signal strength, historical behavior, and strategic priorities, rather than an arbitrary equal distribution. This layered approach aligns the scoring framework with measurable business outcomes.
For example, if CSAT provides a more stable satisfaction signal than NPS, it can receive a higher mathematical weight in the VoC score.
- (Tier 5) All-Up CSI Score (Sum of Weighted Composite Scores): Aggregates the composite
scores into the final executive-level signal. This structured aggregation:
- Reduces sensitivity to isolated or noisy data points.
- Prevents an anomalous KPI from skewing the executive view.
- Preserves meaningful, directional changes.
- Surface sustained trends that require action.