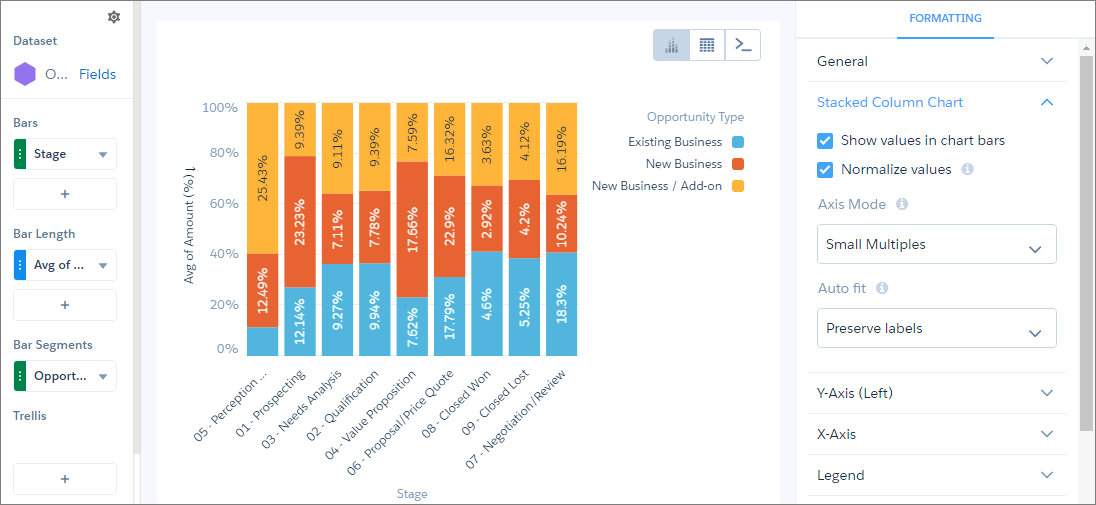
Use a column chart (also called vertical bar chart) to show relative counts of things, such as leads or dollars. Use a stacked column chart to show groups within each bar.
Use a column chart (also called vertical bar chart) to show relative counts of things, such as leads or dollars. Use a stacked column chart to show groups within each bar.