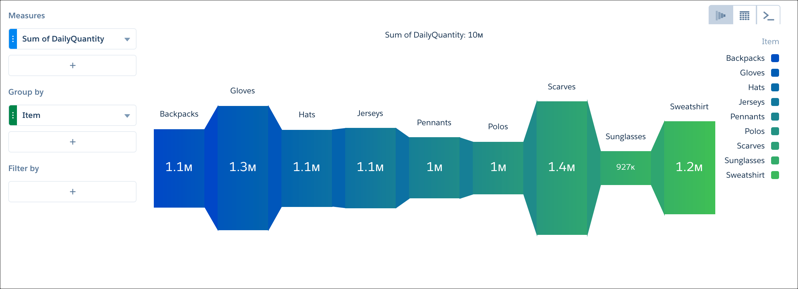
Use an origami chart to create a striking horizontal visualization for easily identifying high- and low-value data when there's a single measure and a single grouping.
Use an origami chart to create a striking horizontal visualization for easily identifying high- and low-value data when there's a single measure and a single grouping.