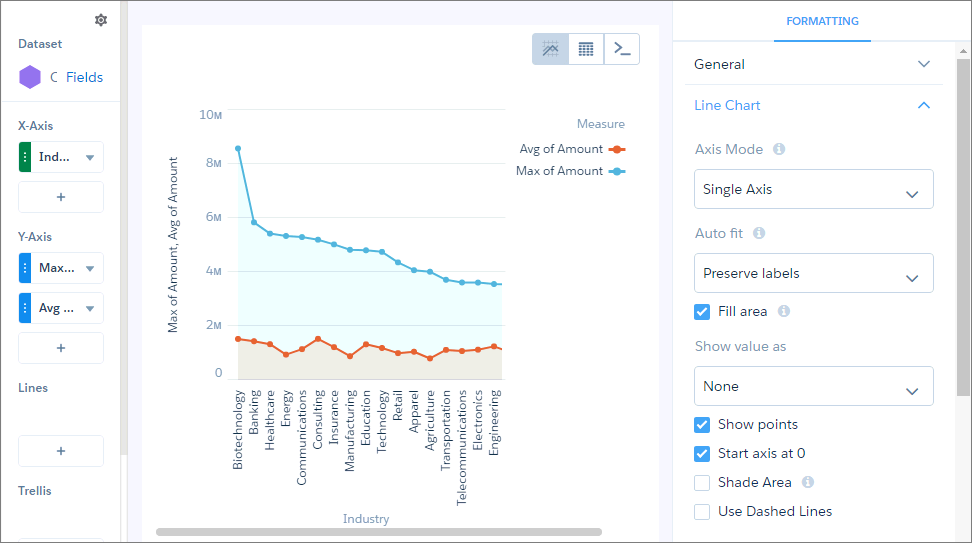
Use a line chart when you have one important grouping representing an ordered set of data and one or more values to show.
Line charts are useful for comparing the value of measures, such as sales and profit totals, over a series of categories (grouped dimensions) such as industries and sales territories.