
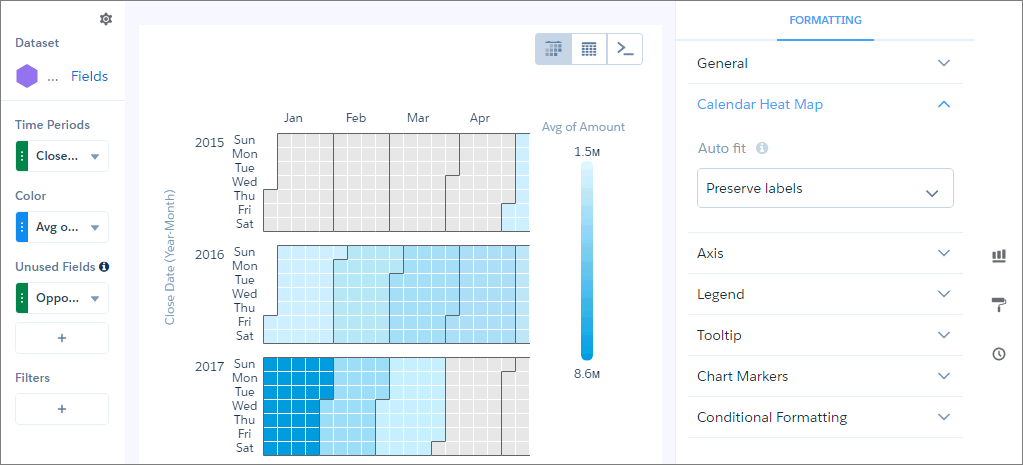
Calendar heat maps are useful for visualizing recurring discrete activities, such as closing accounts, over long periods of time. In this chart, you can easily change the granularity of the time-based grouping, such as from month to week or day.
To use a calendar heat map, set a measure in the Color field and a date dimension in the Time Periods field. The underlying query groups the measure by the specified time period. The chart shows a color for each time period based on the measure.

Note Calendar heat map charts need a defined point in time. If a data point has a null or
missing value for its time-related field, the chart can’t place it on the time axis. As a
result, rows with a null value in the axis field are excluded.