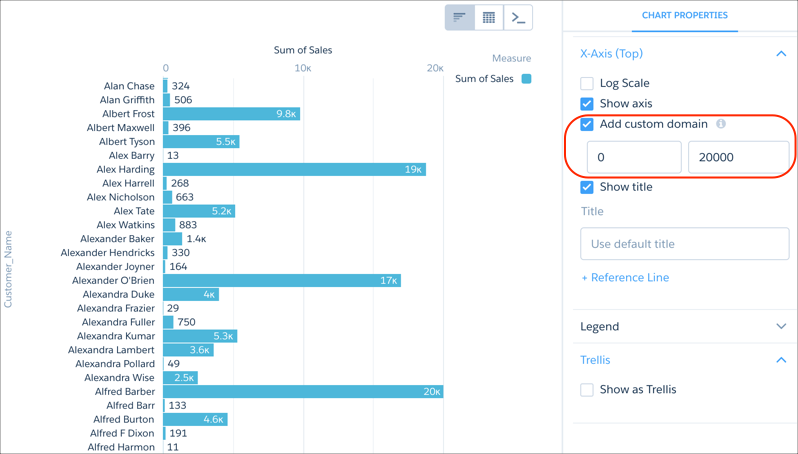
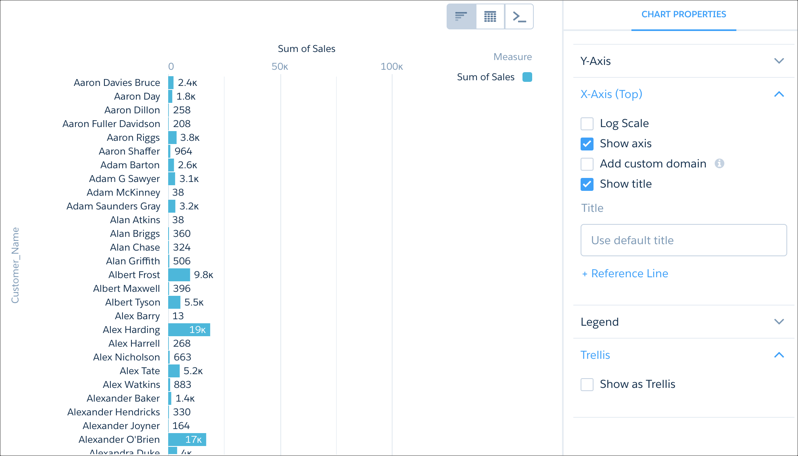
If the domain on the chart is too large, chart elements can be difficult to view, like the bars in this chart.
Set a custom domain to restrict the view to values that bring smaller values into view. Click Add custom domain, then set the domain's bounds be entering minimum and maximum values.