
This chart shows the specific reasons behind each billing outcome with percentages, plus drill-down into individual conversations and turn counts. Filter by "Not Resolved" to uncover knowledge gaps or spot user drop-off points.
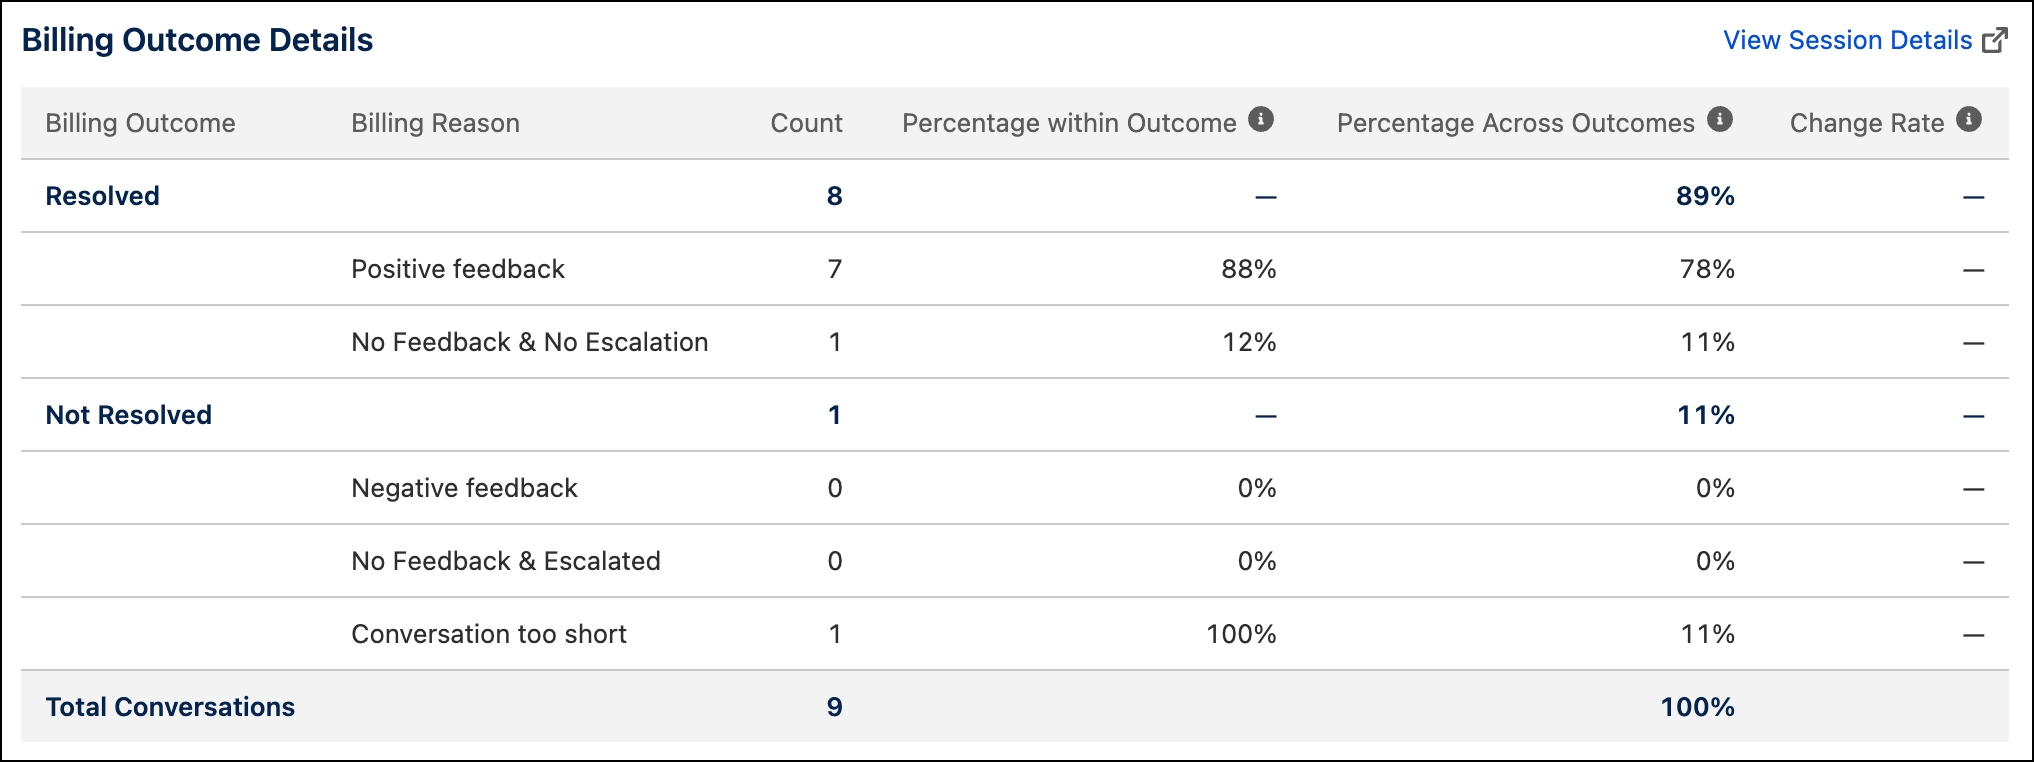
| What to Look For | Individual conversation metrics Turn counts Specific resolution or non-resolution reasons |
| Actions to Take |
Identify Knowledge Gaps: Filter by "Not Resolved" to find common unhandled topics and build new Knowledge content or agent topics. Optimize Flow: Analyze short conversations to identify user drop-offs or prompt confusion. |