
Worked examples showing how promotion border correction calculates read values from the weekly and monthly Promotion Measure Result tables, including a year-offset scenario.
Required Editions
|
Available in: Lightning Experience Available in: Enterprise and Unlimited Editions where Consumer Goods Cloud is enabled |
The system reads values from the Promotion Measure Result JSON table if a flexible writeback structure is used.
The writeback structure stores weekly, monthly, and custom values for each product ID in JSON tables based on account plan, promotion, or tactic. To use the writeback structure, you must activate promotion border correction.

Here’s the data for Promotion ABC for a week.
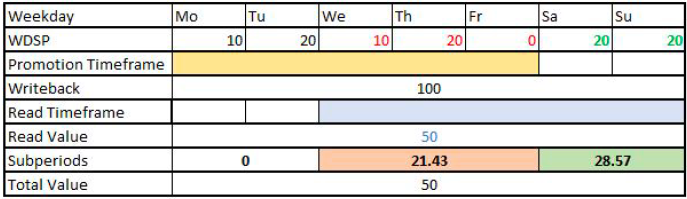
The Promotion time frame spans from Monday through Friday, and the Read time frame spans from Wednesday through Sunday. Based on the overlapping time frames and the writeback value, here’s how the correction factor is calculated.
Read value = Writeback value × (Value of the weekday share for which both time frames are valid) / (Value of the weekday share for which the Promotion time frame is valid) = 100 × (Value of the weekday share from Wednesday to Friday) / (Value of the weekday share from Monday to Friday) = 100 × (10 + 20) / (10 + 20 + 10 + 20) = 50
Based on the overlapping of the time frames, the week has three subperiods:
- Subperiod 1 = Monday through Tuesday
- Subperiod 2 = Wednesday through Friday
- Subperiod 3 = Saturday through Sunday
Here’s how the value of each subperiod is calculated.
- Because subperiod 1 is completely outside the Read time frame, the subperiod is empty.
- Value of subperiod 2 = Read value × (Value of the weekday share of subperiod 2) / (Value of the weekday share of the Read time frame) = 50 × (10 + 20) / (10 + 20 + 20 + 20) = 21.43.
- Value of subperiod 3 = Read value × (Value of the weekday share of subperiod 3) / (Value of the weekday share of the Read timeframe) = 50 × (20 + 20) / (10 + 20 + 20 + 20) = 28.57.
The total distribution value is the sum of values of all the subperiods: 0 + 21.43 + 28.57 = 50.
Here’s the data for Promotion PQR in February.

For February, the Read time frame spans from Feb 18–29, and the child time frame spans from Feb 19–23. Based on the child time frame and the writeback value, here’s how the correction factor is calculated.
Read value = Writeback value × (Value of the weekday share for which both time frames are valid) / (Value of the weekday share for which the promotion time frame is valid) = 100 × (10 + 20 + 20 + 20) / (10 + 20 + 20 + 20) = 100
Based on the Read time frame and condition values (C1, C2), the month has three subperiods.
- Subperiod 1 = Feb 01–17
- Subperiod 2 = Feb 18–21
- Subperiod 3 = Feb 22–29
Here’s how the value of each subperiod is calculated.
- Because subperiod 1 is completely outside the Read time frame, the subperiod is empty.
- Value of subperiod 2 = Read value × (Value of the weekday share of subperiod 2) / (Value of the weekday share of the Read time frame) = 100 × (20 + 10 + 20) / (20 + 10 + 20 + 20 + 20 + 10 + 20 + 10 + 20 + 20) = 29.41.
- Value of subperiod 3 = Read value × (Value of the weekday share of subperiod 3) / (Value of the weekday share of the Read time frame) = 100 × (20 + 20 + 10 + 20 + 10 + 20 + 20) / (20 + 10 + 20 + 20 + 20 + 10 + 20 + 10 + 20 + 20) = 70.59.
The total distribution value is the sum of values of all the subperiods: 0 + 29.41 + 70.59 = 100.
Here’s the data for Promotion ABC for a week.
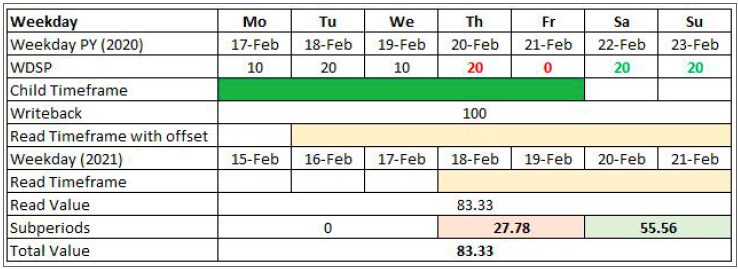
For the given week, the promotion time frame spans from February 17–21, 2020. The Read time frame with year offset = 1 spans from Feb 18, 2021 to Feb 21, 2021. Based on the overlapping time frames and the writeback value, here’s how the correction factor is calculated.
Read value = Writeback value × (Value of the weekday share for which both time frames are valid) / (Value of the weekday share for which the Promotion time frame is valid) = 100 × (Value of the weekday share from Tuesday to Friday) / (Value of the weekday share from Monday to Friday) = 100 × (20 + 10 + 20 + 0) / (10 + 20 +10 + 20 + 0) = 83.33
Based on the overlapping time frames, the week has three subperiods.
- Subperiod 1 = Monday through Wednesday
- Subperiod 2 = Thursday through Friday
- Subperiod 3 = Saturday through Sunday
Here’s how the value of each subperiod is calculated.
- Because subperiod 1 is completely outside the Read time frame, the subperiod is empty.
- Value of subperiod 2 = Read value × (Value of the weekday share of subperiod 2) / (Value of the weekday share of the Read time frame) = 83.33 × (20 + 0) / (20 + 0 + 20 + 20) = 27.78.
- The value of subperiod 3 = 55.56.
The total distribution value is the sum of values of all the subperiods: 0 + 27.78 + 55.56 = 83.33.
The system applies promotion border correction when reading values with a year offset from the Monthly Promotion Measure Result table.